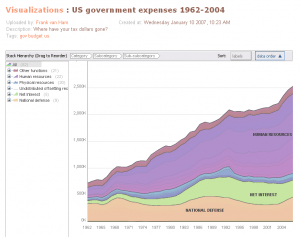
 Too many TV stories use graphics as filler, when there’s no obvious video available to cover a track. Full screens of text and numbers aren’t very attractive but they’re better than a black hole, right? If that’s how you’ve thought about graphics in the past, you need to think again, especially when it comes to presenting stories online.
Used well, a graphic makes data more visually appealing and easier to understand. Newspapers often do this well in print but when they post those static graphics online they fall short by failing to take advantage of the medium. What online gives you is the ability to make graphics interactive, letting users explore data not just look at it. You can use more information in an interactive graphic than you ever could in print or on the air, letting users dig deeper. And there’s one more bonus: users exploring interactive data will stay on your site longer.
The trouble, of course, is that many newsrooms don’t have enough staff to do all that needs to be done on the Web side on a daily basis, much less create interactive graphics to go with any given story. But guess what? They don’t have to. You can do it yourself, for free.
We’ve already shared tips on creating a simple interactive Google Map. Now, check out how to use the online tool Many Eyes to build additional types of interactive graphics:


5 Comments
[…] under web 2.0 NewsLab has developed some nice video tutorials on using two tools to create infographics — Google […]
[…] Using Many Eyes to build your own interactive graphics […]